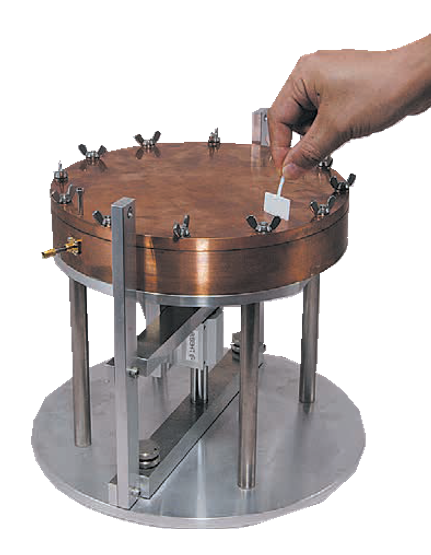
Configurations
Measurement Process
Step 1. |
Step 2. |
| The resonance frequency and the Q value of the empty resonator grow lower when the sample specimen is inserted. The lower the Q value drops, the better the material of the case. The Q value of the material measured with this system, as well as that of the case fabricated with the material measured, are shown in Table 1, where the trend corresponds well with the EMC effect. |
Table 1. Q value by this system of various materials and Q value of case
| Material | Q value of material | Q value of case produced with left material | Effect of EMC |
| Material none | 6265 | ― | ― |
| A | 6133 | 2300 | None |
| B | 5635 | 2110 | Normal |
| C | 5370 | 2000 | Better |
| D | 5218 | 1950 | Best |
One example of the measurement screen when material C is measured is shown as below image.
It is a resonance curve. Q value is indicated in a right part.
Measurement Example
Specifications
| Frequency | Around 1GHz |
| Sample size | Size: 25mm x 25mm Thickness: 0.1mm ~ 2mm |
| Measuring equipment 1. or 2. |
1.Vector network analyzer, Scalar network analyzer 2. Synthesized sweeper with receiver, Windows PC ( GPIB boad with National Instrument driver 〉 |
Ordering Information(Please inform us Part No. or your requirement for measurement)
| MEMC-COE-01 | Resonator Kit |
| COE-01 | Reconator Controller |
| TMR-1D | Resonator Kit for 1GHz |
| TMR-5D | Resonator Kit for 5GHz |
| DMP-70 | Program for evaluating marerials of EMC countermeasure case |
| CM06D - APC2.9(m) APC2.9(m) - 1000 | Coaxial cable assembly at 40GHz : 1m-2 pcs |
| VNA(Optional) | Vector Network Analyzer |
| Windows PC(Optional) | You can purchase Windows PC(Printer included) at the same time |
