1. Main measurement objects
- Characterization of rechargeable batteries and fuel cells
- Monitoring of corrosion, deterioration of concrete, etc.
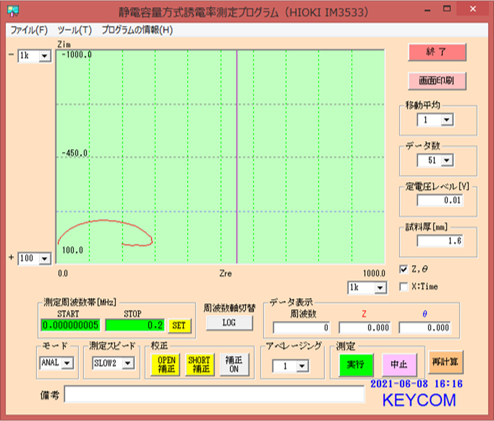
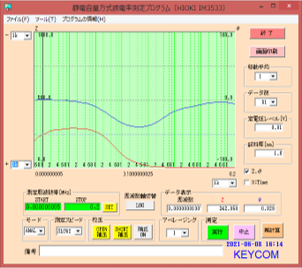
2. Display of measurement result
The measurement results are displayed as Nyquist and Bode diagrams, and the measurement results can be saved as csv or txt files.
Measurement Example ---Iron case in H2SO4 solution
Nyquist diagram |
Bode diagram |
 |
 |
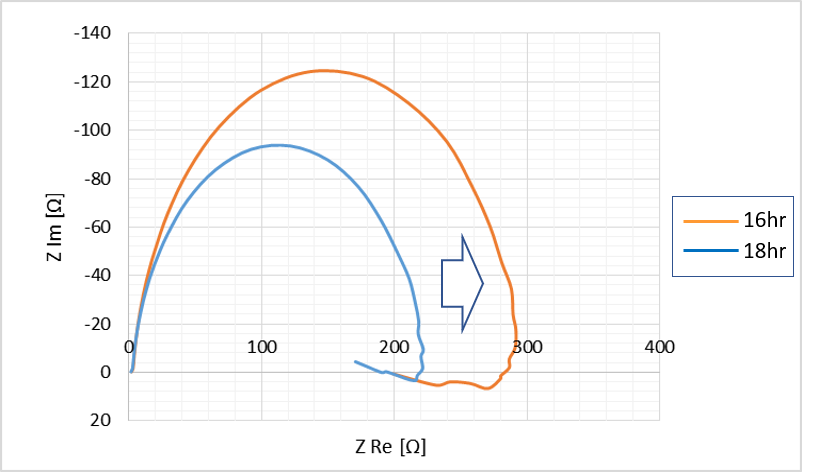
Time variation graph of impedance of iron in H2SO4 solution (Excel) |
 |
3. Topic---Evaluation of battery current collector
The following data shows the change over time of DC internal resistance and AC internal resistance of lithium-ion batteries fabricated using carbon coated foil and plain foil for electrolytic capacitors as current collectors.
Note that the lithium-ion battery was stored at 60°C, and the AC internal resistance was measured at 100 Hz.
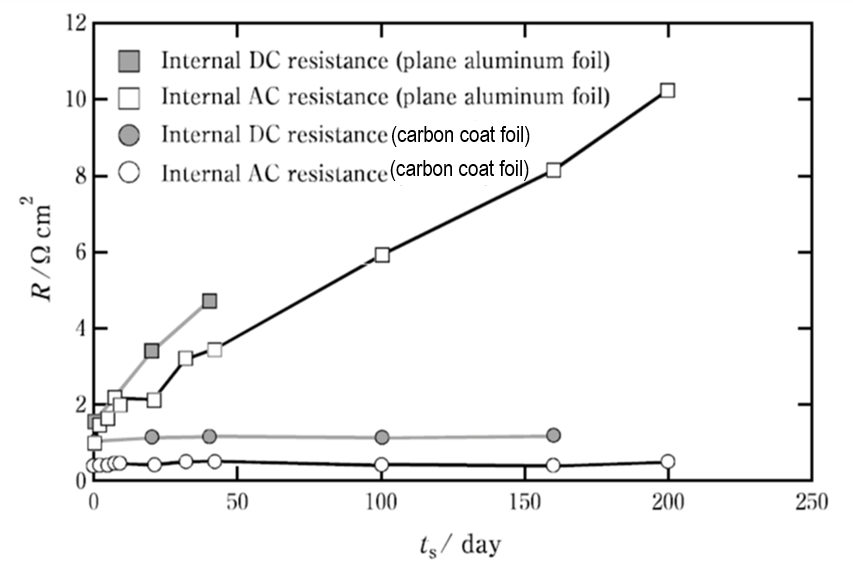 |
The AC internal resistance is lower than the DC internal resistance. This is because the DC internal resistance includes all the resistance components in the battery, including the measurement terminals, while the AC internal resistance mainly reflects only the contact resistance.
In addition, since a battery includes resistance at the interface formed by the contact of various materials such as current collector, positive electrode, negative electrode, active material, and conductive aid, DC alone does not lead to further improvement of the battery configuration.
For this reason, the electrochemical impedance method becomes important.